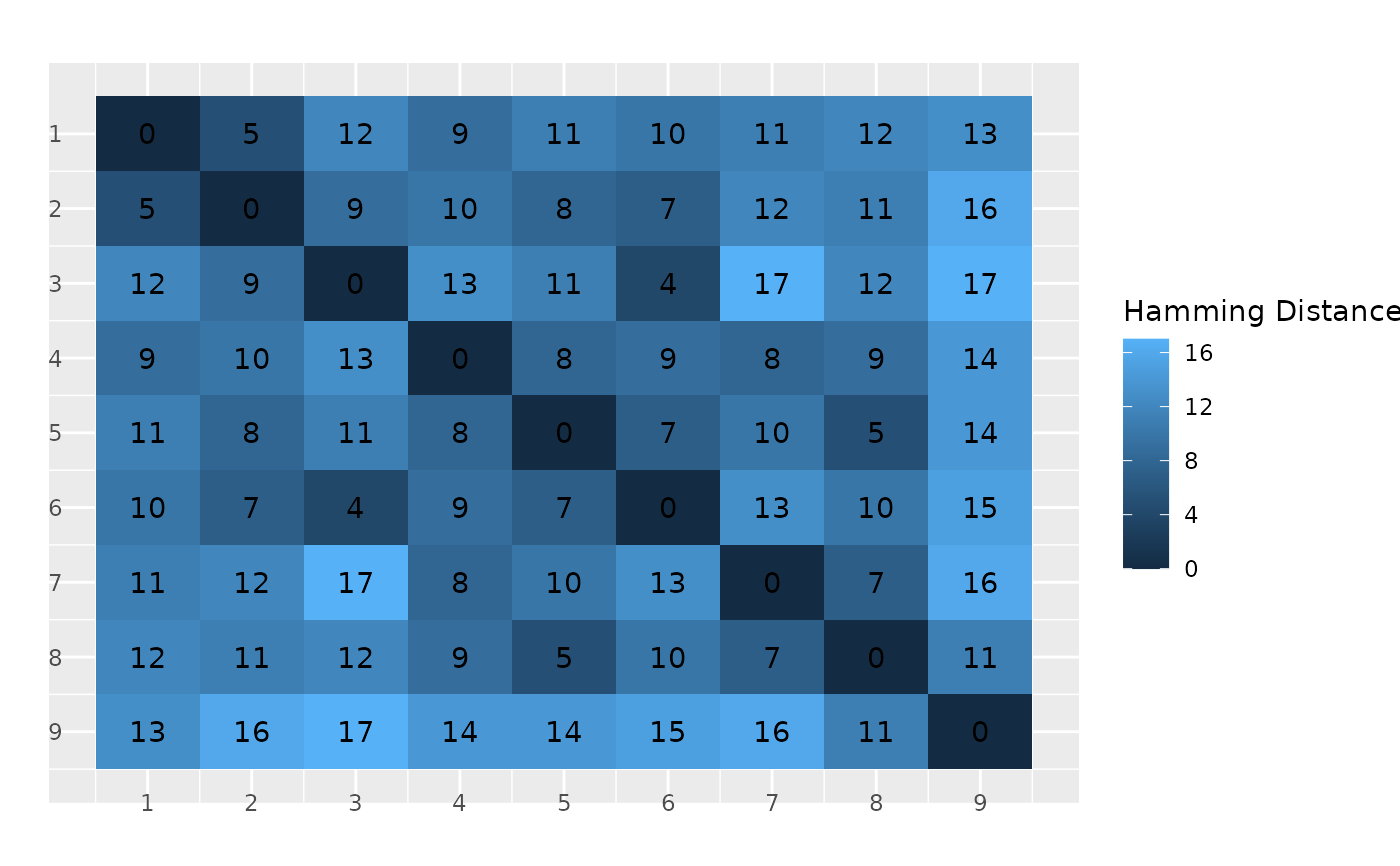
Creates all the heatmaps for a CVN, a heatmap for each pair of \((\lambda_1, \lambda_2)\)
Usage
plot_hamming_distances_cvn(
  cvn,
  absolute = TRUE,
  same_range = TRUE,
  titles = rep("", cvn$n_lambda_values),
  legend_label = "Hamming Distance",
  add_counts_to_cells = TRUE,
  add_ticks_labels = TRUE,
  t = -6,
  r = -8,
  verbose = TRUE
)
Arguments
- cvn
A
cvnobject- absolute
If
FALSE, rescaled to[0,1]- same_range
If
TRUE, all heatmaps have the same range of values of the Hamming distance shown (Default: TRUE)- titles
Title of the plots (Default is none)
- legend_label
Title of the legend (Default: "Hamming Distance")
- add_counts_to_cells
If
TRUE, counts from the matrix are added to the plot (Default:TRUE)- add_ticks_labels
If
TRUE, the number corresponding to the graph is add to the plot (Default:TRUE)- t
Distance between tick labels and x-axis (Default: -6)
- r
Distance between tick labels and y-axis (Default: -8)
- verbose
If
TRUE, shows progress bar (Default:TRUE)
Examples
path <- system.file("cvnfit.rda", package = "CVN")
load(path)

plot_hamming_distances_cvn(fit)
#> Determining Hamming distances between the graphs...
#>
#> $m
#> [1] 9
#>
#> $p
#> [1] 10
#>
#> $W
#>       [,1] [,2] [,3] [,4] [,5] [,6] [,7] [,8] [,9]
#>  [1,]    0    1    0    1    0    0    0    0    0
#>  [2,]    1    0    1    0    1    0    0    0    0
#>  [3,]    0    1    0    0    0    1    0    0    0
#>  [4,]    1    0    0    0    1    0    1    0    0
#>  [5,]    0    1    0    1    0    1    0    1    0
#>  [6,]    0    0    1    0    1    0    0    0    1
#>  [7,]    0    0    0    1    0    0    0    1    0
#>  [8,]    0    0    0    0    1    0    1    0    1
#>  [9,]    0    0    0    0    0    1    0    1    0
#>
#> $distances
#> $distances[[1]]
#>       [,1] [,2] [,3] [,4] [,5] [,6] [,7] [,8] [,9]
#>  [1,]    0   11   16   15   14   14   17   16   13
#>  [2,]   11    0    7   10    5    9   12   11   12
#>  [3,]   16    7    0   13   10    8   17   12   11
#>  [4,]   15   10   13    0    7    9    4    7   10
#>  [5,]   14    5   10    7    0    8   11    8   11
#>  [6,]   14    9    8    9    8    0   13   10    9
#>  [7,]   17   12   17    4   11   13    0    9   12
#>  [8,]   16   11   12    7    8   10    9    0    5
#>  [9,]   13   12   11   10   11    9   12    5    0
#> attr(,"class")
#> [1] "cvn:distancematrix"
#>
#>
#> $results
#>   id lambda1 lambda2      gamma1       gamma2 converged       value
#> 6  6       2     1.5 0.004938272 0.0009259259      TRUE 0.009319307
#>   n_iterations      aic      bic     ebic edges_median edges_iqr
#> 6           26 4404.656 4651.844 5407.092            8         1
#>
#> $plots
#> $plots[[1]]

#>
#>
#>
#>