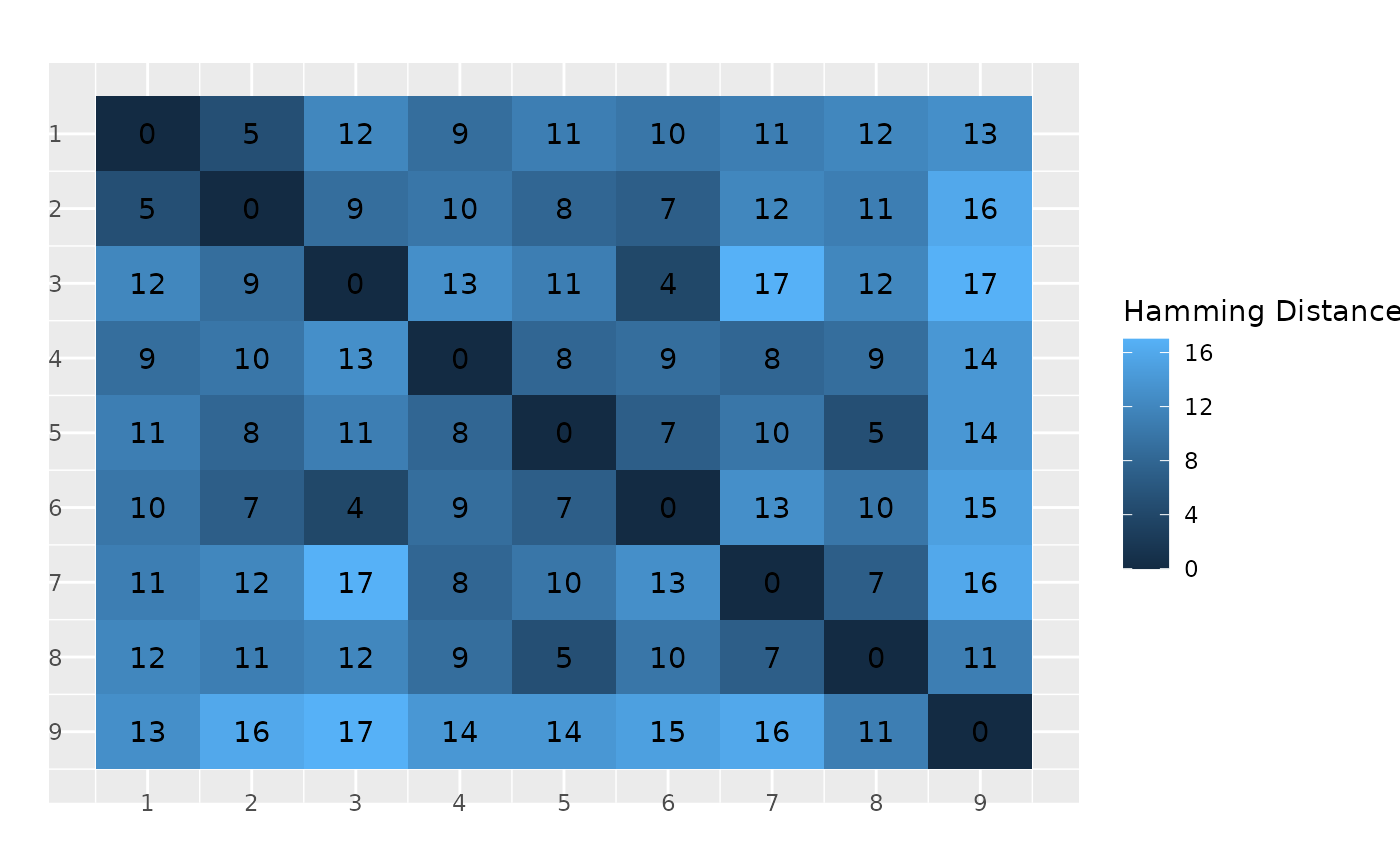
Returns a heat map of the distance matrix for a particular CVN
Usage
plot_hamming_distances(
  distance_matrix,
  absolute = TRUE,
  limits = c(NA, NA),
  title = "",
  legend_label = "Hamming Distance",
  add_counts_to_cells = TRUE,
  add_ticks_labels = TRUE,
  t = -6,
  r = -8
)
Arguments
- distance_matrix
Symmetric matrix with distances
- absolute
If
FALSE, rescaled to[0,1]- limits
The limits for the values of the Hamming distance
- title
Title plot (Default is none)
- legend_label
Title of the legend (Default: "Hamming Distance")
- add_counts_to_cells
If
TRUE, counts from the matrix are added to the plot (Default:TRUE)- add_ticks_labels
If
TRUE, the number corresponding to the graph is add to the plot (Default:TRUE)- t
Distance between tick labels and x-axis (Default: -6)
- r
Distance between tick labels and y-axis (Default: -8)
Examples
path <- system.file("cvnfit.rda", package = "CVN")
load(path)
hd <- hamming_distance(fit, verbose = FALSE)

plot_hamming_distances(hd$distance[[1]])